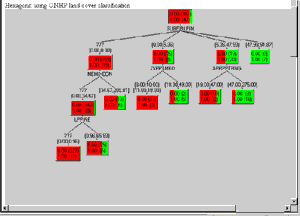
 The tree diagrams are part of the species analysis window. The diagrams
are a graphical representation of the Classification Tree Analysis for
the species. For most species, three different Tree Analyses were run:
based on ONHP land cover data for the hexagons, based on AVHRR data for the
hexagon, and based on ONHP land cover data for the squares. All three
analyses were not run for every species.
Background on the analyses are given in another section (see the Statistical exploration in the Methods section). While reviewing these paragraphs and diagrams, keep in mind that these are statistical associations, not proofs that particular variables are causing a species to be present or absent during the breeding season.
 The boxes in each diagram represent categories of a variable. (See the
list of
variable definitions.) Each tree is
hierarchical, with the single box at the top of the diagram representing the
independent variable that was found to have the strongest statistical association
with presence/absence of the named species among hexagons in Oregon. The
abbreviation identifying that variable is located directly under the box,
and is identical or similar to its code in the databases contained on this CD.
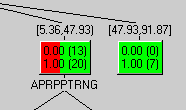
The parenthesized numbers inside the top box and the other boxes are the number
of hexagons in which the species was not found (indicated by "0.00") and found
(indicated by "1.00") under the conditions stated. Boxes that are mostly green
indicate there were more hexagons containing the species than hexagons without,
whereas boxes that are mostly red indicate the converse.
 Above the boxes in
the second and lower rows, there are sequences or lists of numbers. These describe
a statistically significant numeric range of the variable in the row above,
linked to the numbers with a line. Note that row-two variables which are the
most significant in the top variable's high range are not necessarily the ones
that are most significant in the primary variable's low range.
The accuracy score, shown at the top of most diagrams, is a measure of the amount of variability in a species' statewide distribution that is explained just by the variables included in the tree diagram. It can range from 0 (none explained) to 100 (all explained). These scores are best used to compare the relative accuracy of trees of different species, rather that to suggest that a particular set of variables is or is not accurate.